⚡ TL;DR — The Quick Version
- ▸Price weakness plus institutional expansion doesn’t fit the usual late-cycle pattern most people expect
- ▸Volatility dropping below traditional equities is historically a mid-cycle signal, not a top
- ▸Distribution and accumulation look identical in real-time—only the next three months will clarify which one this was
- ▸Mixed signals are the entire point: every cycle consolidates when everyone’s most confused about where we might be next
Everyone’s looking at the wrong thing.
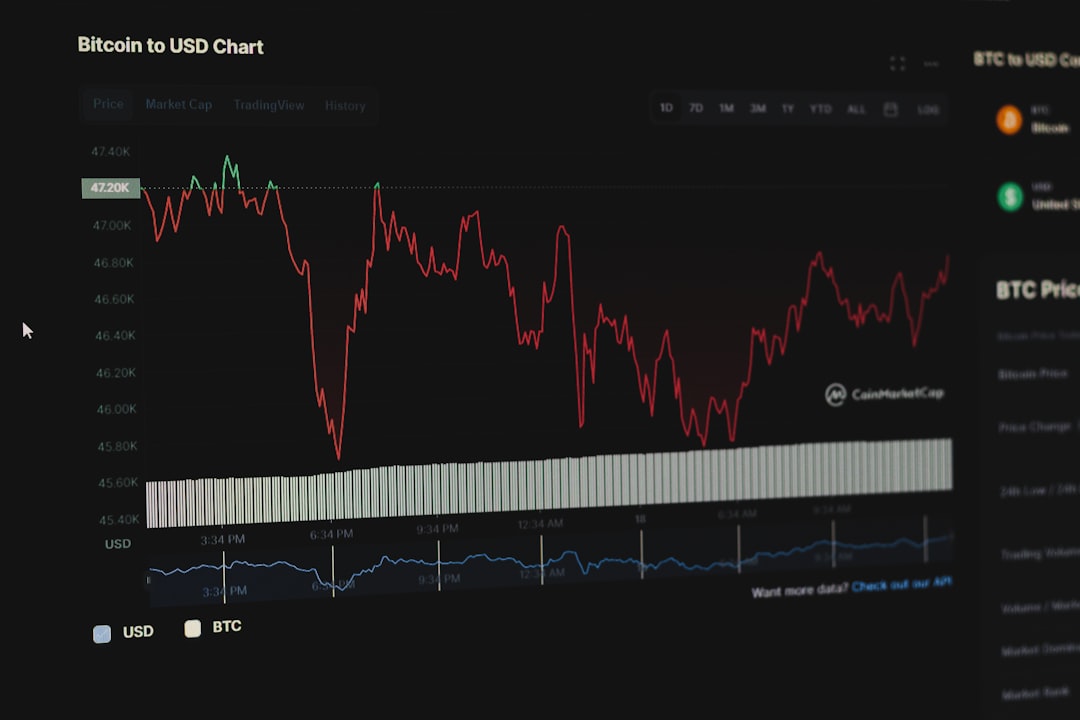
Bitcoin’s trading under $62.5K. AI hype that drove half the market higher for months is cooling. Volatility just fell below some traditional equity markets—South Korea’s, if you’re keeping score. And everyone’s trying to figure out where we might be in the crypto market cycle.
Here’s what makes this moment genuinely confusing: institutions are making big moves at the exact same time price is showing weakness. SBI’s pushing cross-border expansion. Robinhood’s going hard into DeFi. These aren’t late-cycle distribution plays—they’re infrastructure bets that take years to pay off.
So which is it? Are we watching smart money quietly exit while retail holds the bag, or are we in mid-cycle consolidation before another leg up? The honest answer is that both scenarios look identical in real-time, and that’s exactly the point.
Why Price Action Tells You Less Than You Think
Let’s start with what we actually know. Bitcoin ran from under $16K in late to above $73K in March . That’s a 4.5x move in sixteen months. Then it pulled back, chopped sideways, and now sits around $62K—a roughly 15% correction from the peak.
A 15% pullback is background noise in crypto. A drawdown—the distance from peak to trough—of 70% or 80% is normal in bear markets. By that standard, we’re barely scratched. But context matters, and the context here is where might we sit in the four-year cycle that Bitcoin historically follows.
The halving—when Bitcoin’s new supply issuance gets cut in half—happened in April . Historically, the twelve to eighteen months after a halving produce the strongest gains. If that pattern holds, we’re still early-to-mid cycle, not late. But halvings are backward-looking supply mechanics, and markets are forward-looking expectation engines. The ETFs launched before the halving this time, front-running the usual script.
That’s the first signal everyone’s reading wrong. They’re waiting for the post-halving pump like it’s a law of physics, ignoring that this cycle already priced in pieces of the next one.
What Does Dead Volatility Actually Mean?
Volatility dying feels bearish. Fewer big moves, smaller ranges, traders getting bored and leaving—that’s usually how tops form, right?
Not quite. Low volatility in crypto has historically shown up in mid-cycle consolidations, not just at exhaustion tops. Think of it as the market taking a breath after a sharp move. The – cycle had a multi-month dead zone around $600-$700 before the run to $20K. The – cycle paused near $10K for months before exploding higher.
Boring price action in crypto isn’t a top signal—it’s the market deciding whether to rotate or accelerate.
What is unusual this time is that Bitcoin’s realized volatility briefly dropped below traditional equity markets. That almost never happens. South Korea’s KOSPI was swinging harder than BTC for a stretch in recent weeks. Geopolitical risk, rate uncertainty, and election noise are compressing crypto vol while expanding it elsewhere.
For most people, that reads as “crypto’s broken” or “the trade is over.” The alternative read: institutional flows and ETF structuring are dampening wild swings, making Bitcoin behave more like a macro asset. That’s exactly what happens when an asset matures mid-cycle, not when it dies at the end of one.
Are Institutions Buying the Top or Building for the Next Leg?
Here’s where the mixed signals get loudest. SBI Holdings, one of Japan’s largest financial groups, just announced cross-border crypto expansion into the U.S. and Europe. Robinhood’s rolling out its own DeFi wallet and pushing deeper into on-chain trading. Fidelity, BlackRock, and others keep adding to ETF education and infrastructure.
These aren’t quarter-to-quarter plays. They’re multi-year infrastructure bets. If smart money genuinely thought we were in late-cycle distribution—the phase where insiders sell to retail at the top—they wouldn’t be deploying capital into platforms that take eighteen months to break even.
🔥 Hot Take
If institutions are exiting, they’re doing it by expanding globally and building DeFi onramps. Make it make sense.
The counterargument is that late also saw massive infrastructure expansion right before the collapse. Crypto.com bought stadium naming rights. Exchanges were hiring thousands. Then everything imploded six months later. Fair point. But that cycle was fueled by unsustainable leverage, sketchy stablecoins, and companies like Celsius offering 20% yields with no real business model. This time, the infrastructure is boring: ETFs, regulated custodians, and compliance-heavy onramps. Boring scales. Ponzi schemes don’t.
How Do You Tell Distribution from Consolidation?
You don’t. Not in real-time.
Distribution is when smart money sells to dumb money at the top. Consolidation is when the market digests gains and builds energy for the next move. Both look like choppy, range-bound trading with declining volume. The difference only becomes obvious months later when price either collapses or breaks out.
Here’s what the data shows right now:
| Indicator | Late-Cycle Top | Mid-Cycle Consolidation |
|---|---|---|
| Institutional activity | Slowing / exits | Expanding / building |
| Leverage / funding | Extreme / unsustainable | Moderate / reset |
| Volatility trend | Spiking then collapsing | Declining steadily |
| Retail sentiment | Euphoric / FOMO | Bored / skeptical |
Right now, three of those four lean mid-cycle. Institutions are expanding, leverage is moderate after the reset earlier this year, and retail is clearly bored—search interest and social engagement are down sharply from the March peak. The only ambiguous signal is volatility, which is compressing in an unusual way.
That doesn’t mean we can’t top here. Markets don’t follow scripts. But if you’re trying to figure out where we might be in the cycle, the weight of evidence leans toward consolidation, not distribution.
Sources & further reading
What Happens Next—And What to Watch
The next three months will clarify everything. If Bitcoin breaks above $70K with conviction and holds, this was mid-cycle accumulation and everyone calling the top will quietly delete their posts. If it breaks below $50K and keeps falling, this was distribution and the people screaming “bubble” will take a victory lap.
What you watch matters more than what you guess. Here’s what actually moves the needle:
ETF flows: Net inflows above $500M per week suggest institutions are still accumulating. Sustained outflows mean they’re rotating elsewhere.
Funding rates: These measure the cost of holding leveraged long positions in futures markets. When funding spikes above 0.05% daily, leverage is getting dangerous. Right now it’s near zero—neutral to slightly bullish.
On-chain activity: Wallets holding 100-10,000 BTC (the “smart money” cohort) have been accumulating steadily since August. If that reverses, it’s a warning sign.
None of this tells you to buy or sell. It tells you how to think about probabilities instead of predictions. Most people lose money in crypto because they trade certainty in a market built on uncertainty. The ones who survive understand that where we might be in the cycle is always a probabilistic question, not a binary one.
Mixed signals are the entire point. Cycles don’t announce themselves with flashing lights. They reveal themselves slowly, in pieces, to the people paying attention to the data instead of the headlines.
How long does a typical Bitcoin market cycle last?
Historically, about four years from bottom to bottom, tied to the halving schedule. Bear markets last 12-18 months with 70-80% drawdowns, then bull markets run for 18-24 months. But each cycle has gotten longer and less extreme as the market matures and institutional money dampens volatility.
What’s the difference between realized and implied volatility?
Realized volatility measures how much an asset actually moved over a past period—it’s backward-looking. Implied volatility is what options traders expect future movement to be—it’s forward-looking. When Bitcoin’s realized vol drops below 30 while implied stays elevated, it often precedes a sharp move in either direction.
Can geopolitical risk actually explain lower crypto volatility?
It sounds backward, but yes. When macro uncertainty spikes—wars, elections, rate confusion—correlations across all risk assets tighten. Bitcoin starts moving with equities and bonds instead of independently, which can compress its standalone volatility even as overall market stress rises. It’s trading more like gold did in the 2010s: a macro hedge that moves on big picture flows, not its own narrative.
The WealthPathly Desk
WealthPathly · Bitcoin & Crypto
We cover markets, crypto, and the economy in plain English — sharp opinions, real numbers, no hype. Every piece is based on publicly available data and reputable sources, and is meant to make you a better-informed reader, not to tell you what to buy.
Disclaimer
This article is for general educational and informational purposes only. It is not financial, investment, tax, or legal advice, and nothing here is a recommendation to buy or sell any specific asset. Markets carry real risk and you can lose money. Your situation is unique — consider speaking with a qualified professional before making decisions. Crypto assets are especially volatile and can fall sharply or go to zero; only you are responsible for your own research and risk.